Testing
Testing a real-time operating system is a difficult task. Various contraints limit the tester's ability to fully test an RTOS without affecting performance. These are the approaches that we used to test our RTOS.
Testing Limitations
Out of the box the AT90USBKey has only a handful of useful testing methods.
- Toggle the four LEDs
- Step though the code in AVR Simulator
Both of the these approaches have some serious problems. AVR Simulator does not emulate external hardware devices, limiting testing to the basic kernel operations. And blinking LEDs can lead to ambiguous debugging.
Error Codes
We decided to use the onboard LEDs to display error blink codes. A blink code is similar to a BIOS beep code. Blink codes alert the developer of a problem without using a display.
Displayed a blink code is done by first turning all the lights for a short burst, then a blink code in shorter bursts of RED ( run-time error ) or GREEN ( initialization error ).
ALL_LIGHTS GREEN GREEN GREEN
The above textual representation of a blink code is indicating initialization error number three. Which the user of the RTOS may lookup in error_codes.h
...

/** PERIODIC name is out of range [1 .. MAXNAME] */
ERR_2_CREATE_NAME_OUT_OF_RANGE,

/** PERIODIC task assigned name IDLE */
ERR_3_PERIODIC_NAMED_IDLE,

/** PERIODIC name already used */
ERR_4_PERIODIC_NAME_IN_USE,

...
Traces
A trace is a log file. When used to to debug operating systems, it is often called a kernel trace. A kernel trace is a log that contains all the steps preformed by an operating system during the execution of a program.
Projects such as SUN's DTRACE provides tracing abilities to Solaris, Linux, and Mac OSX Leopard. Kernel tracing would be an excellent way to fully test our RTOS, but due to limitation on memory and debugging methods a kernel trace was not used.
Instead we will use simple traces generated by the users application. These traces will contain simple log data accumulated at key points during the operation of a test.
Setting up the Trace
Since the AT90USBKey has no display, we must extract our trace data using UART. A simple RS232 interface connects the AT90USBKey to a terminal computer collecting data.

An Example
The following is an example of a simple test designed to test the basic functionality of periodic tasks.
enum { A=1, B, C, D, E, F, G };
const unsigned int PT = 7;
const unsigned char PPP[] = {A, 5, B, 5, C, 5, D, 5, E, 5, F, 5};

EVENT* print_event;

void generic_task(void)
{
    int arg = 0;
    arg = Task_GetArg();

    for(;;)
    {
        add_to_trace(arg);
        Task_Next();
    }
}

int main(void)
{
    /* setup the test */
    uart_init();
    uart_write((uint8_t*)"\r\nSTART\r\n", 9);
    set_test(2);

    print_event = Event_Init();

    Task_Create(generic_task, A, PERIODIC, A);
    Task_Create(generic_task, B, PERIODIC, B);
    Task_Create(generic_task, C, PERIODIC, C);
    Task_Create(generic_task, D, PERIODIC, D);
    Task_Create(generic_task, E, PERIODIC, E);
    Task_Create(generic_task, F, PERIODIC, F);

    Event_Wait(print_event);
    print_trace();
}
In this code the function add_to_trace(int) adds an integer to the log file. This function simply places the integer in an array and does not send it over UART. This avoids problems with latency, and trace functions affecting the results of our test. The function print_trace takes all the accumulated integers and prints them to UART. This function is only called at the end of the test signaled by add_to_trace() when it has accumulated enough datax.
The Expected Output
The expected output of this test is for all the periodic tasks to run in a first come first served fashion.
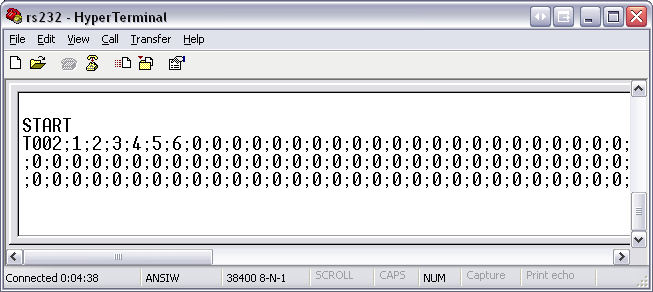
T002;1;2;3;4;5;6;1;2;3;4;5;6;1;2;3;4;5;6;1;2;3;4;5;6;..
T002 indicates the this is test number two, and the semi-colon delimited numbers represent the PPP array name value of the task. The order we created them was 1,2,3,4,5,6 therefore we expected the same FCFS ordering to appear in the trace.
Now its time to run some tests.